Revealing the Secrets of Lyman Alpha Emitters: The Power of Stacking
July 8, 2023
The study of Lyman Alpha Emitters (LAEs) provides a unique window into the early universe, allowing us to unravel the mysteries of galaxy formation and evolution. The HETDEX survey will ultimately map out the 3D positions of over one millions of these galaxies and based on their distribution we will be able to measure key cosmological parameters of the early universe.
The strong Lyman Alpha emission line, due to ionized hydrogen gas, is detectable on relatively short time exposures (~20 min) using the VIRUS spectrograph on the Hobby-Eberly Telescope. But these short exposures pick up little information about the galaxy and its stellar composition.
In this latest HETDEX paper, accepted for publication in Astrophysical Journal, University of Texas Graduate Student Dustin Davis demonstrates how stacking a sample of 5o thousand of these distant galaxies from the first public source catalog from HETDEX can shed light about the average LAE galaxy to remarkable details not seen before.
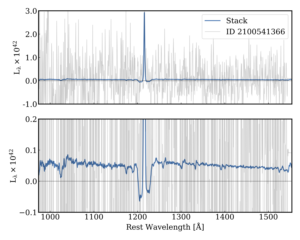
By combining these spectra, we significantly enhance the signal-to-noise ratio, thereby exposing spectral features that would otherwise be obscured by noise. The stacked spectrum, shown in Figure 1 and Figure 2 in blue, is created by stacking over 50 thousand galaxy spectra. By statistically combining the spectra the signal is boosted by the number of sources combined, meanwhile the uncertainty in the combined spectrum is reduced relative to the combined signal. This reveals detail in the spectrum not seen in a single object. In the top panel of Figure 1, the strength of the emission line relative to the noise is roughly 1000, while an example single LAE spectrum shown in grey has a signal-to-noise ratio of 6. Similarly impressive stacking improves the signal in the continuum emission from a signal-to-noise ratio of just 0.06 to a statistically meaningful value of 20.
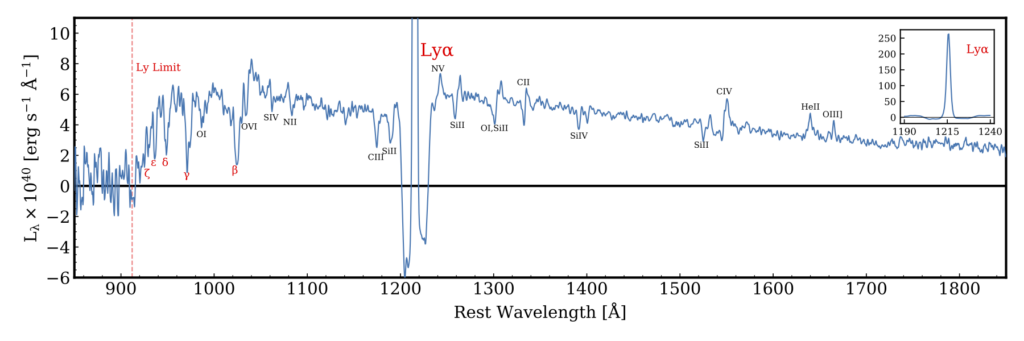
From this signal in the continuum emission, we use theoretical models to learn more about the average LAE measured in the HETDEX survey. We find that the galaxies are composed of a relatively young population of stars borne in an environment of relatively few metals. These relatively young galaxies are also quite low mass with masses about 100 million times the mass of the sun, and over 10 thousand times smaller than our own Milky Way Galaxy.
About the Scientist
University of Texas Graduate Student Dustin Davis is a HETDEX Architect and the lead researcher on the galaxy stacking work discussed in this blog post. He is also the developer of ELiXER, the emission line classifying tool developed to decipher which HETDEX signals are emitted from very distant galaxies and which are from less distant galaxies.